Repository navigation
refactor: compute component plot data in private helpers - #2756
Merged
Merged
Conversation


Add _forecast_component_plot_data and _seasonality_plot_data to
prophet/plot.py. They return the data that the component plots draw
(the component values, the uncertainty interval and, for forecast
components, the cap and floor) as a dataframe. The matplotlib and
plotly plotting functions now take their data from these helpers
instead of computing it inline, so the same data can be reused by
other plotting code.

The plots are unchanged. New tests in tests/test_plot.py check the
helpers against the forecast and predict_seasonal_components, and
check that both backends draw exactly the helper data.


Collaborator
|
It'd be good to show the plots before / after (doesn't have to be all of them) to validate visually. |

Contributor
Author
|
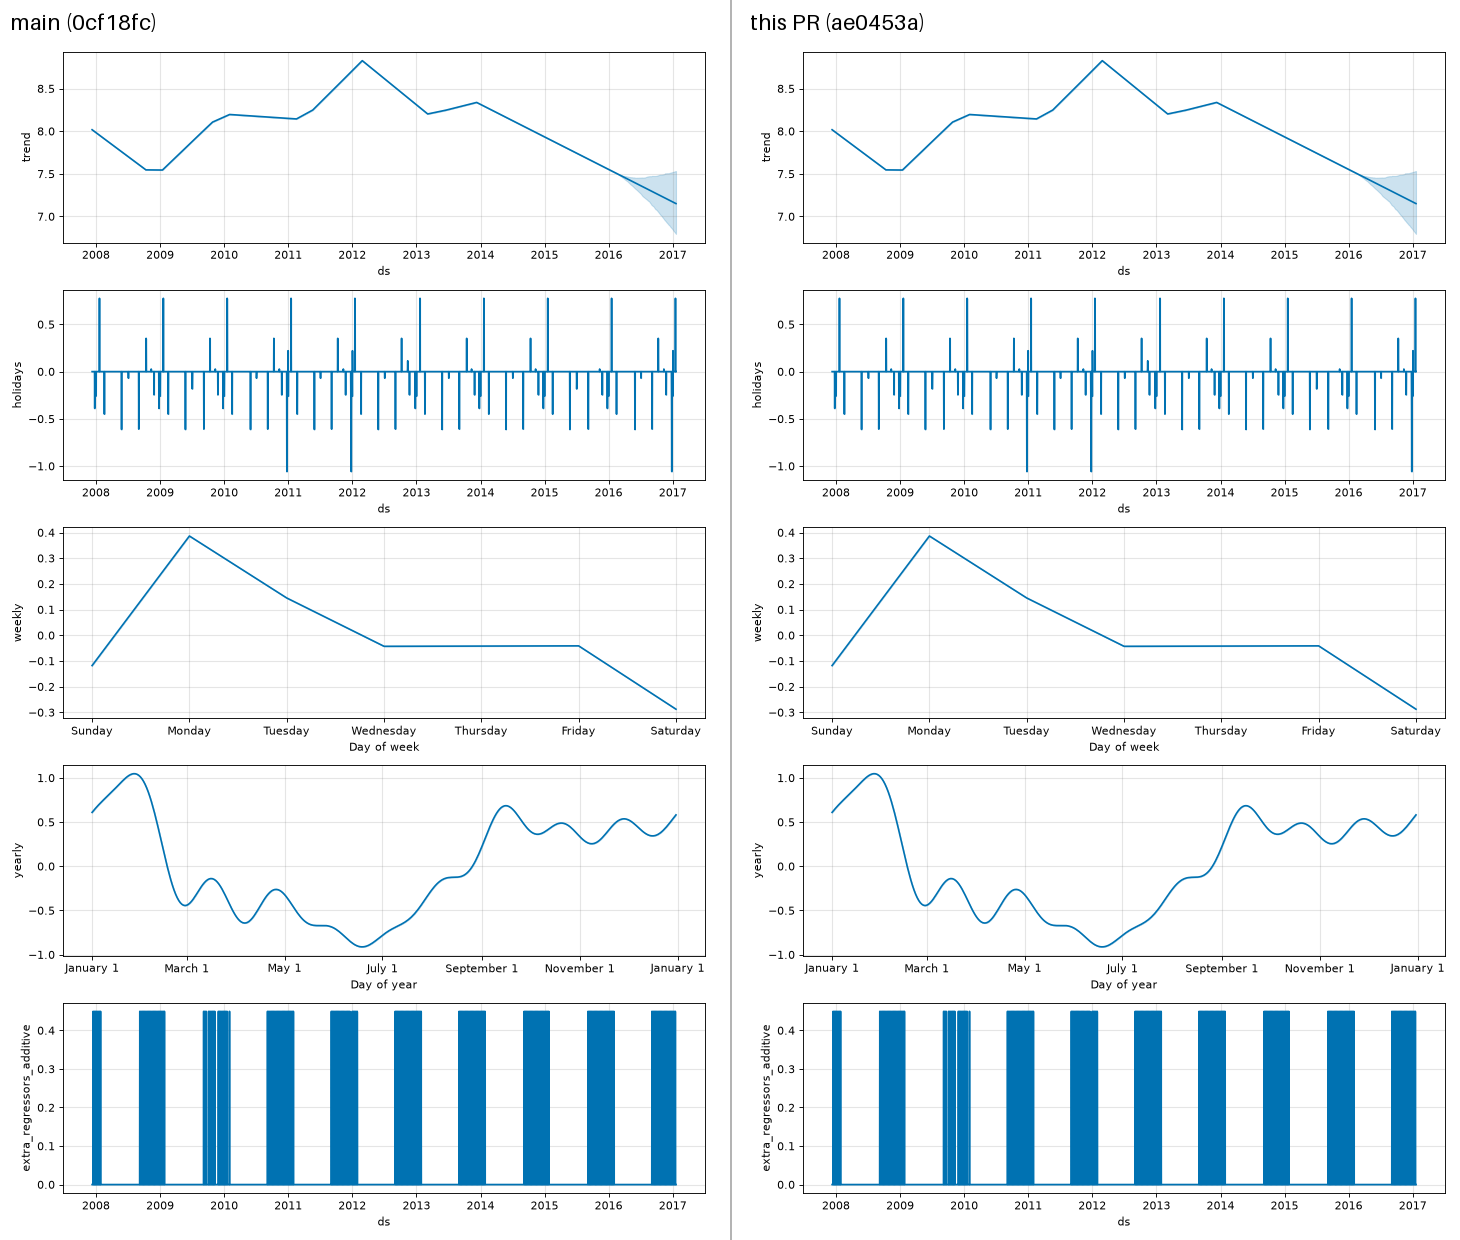
Sure, here are four of them. In each image the left half is main (0cf18fc) and the right half is this branch, drawn from the same fitted model and forecast. The two halves are also pixel identical. Additive model with US holidays and an extra regressor,
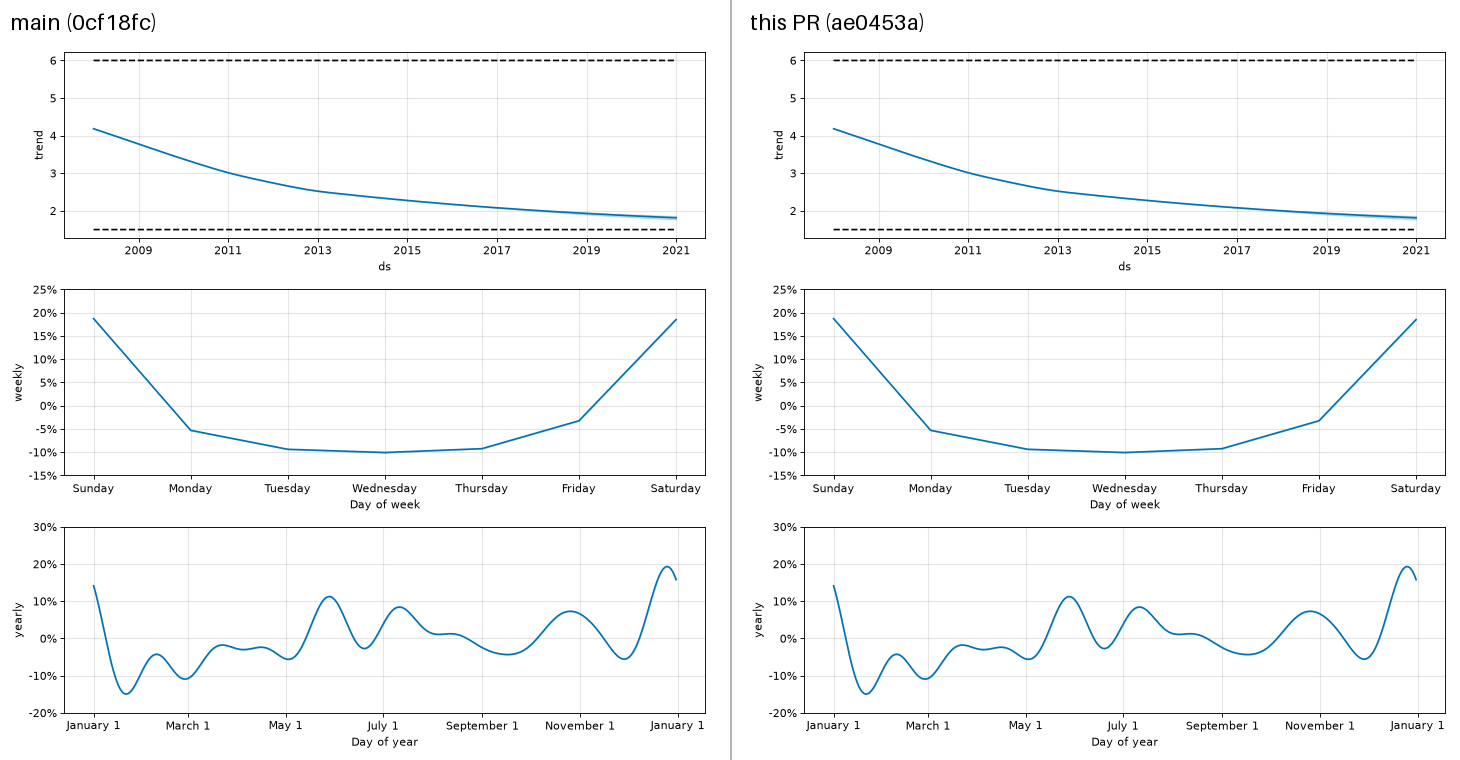
Logistic growth with cap and floor and multiplicative seasonality,
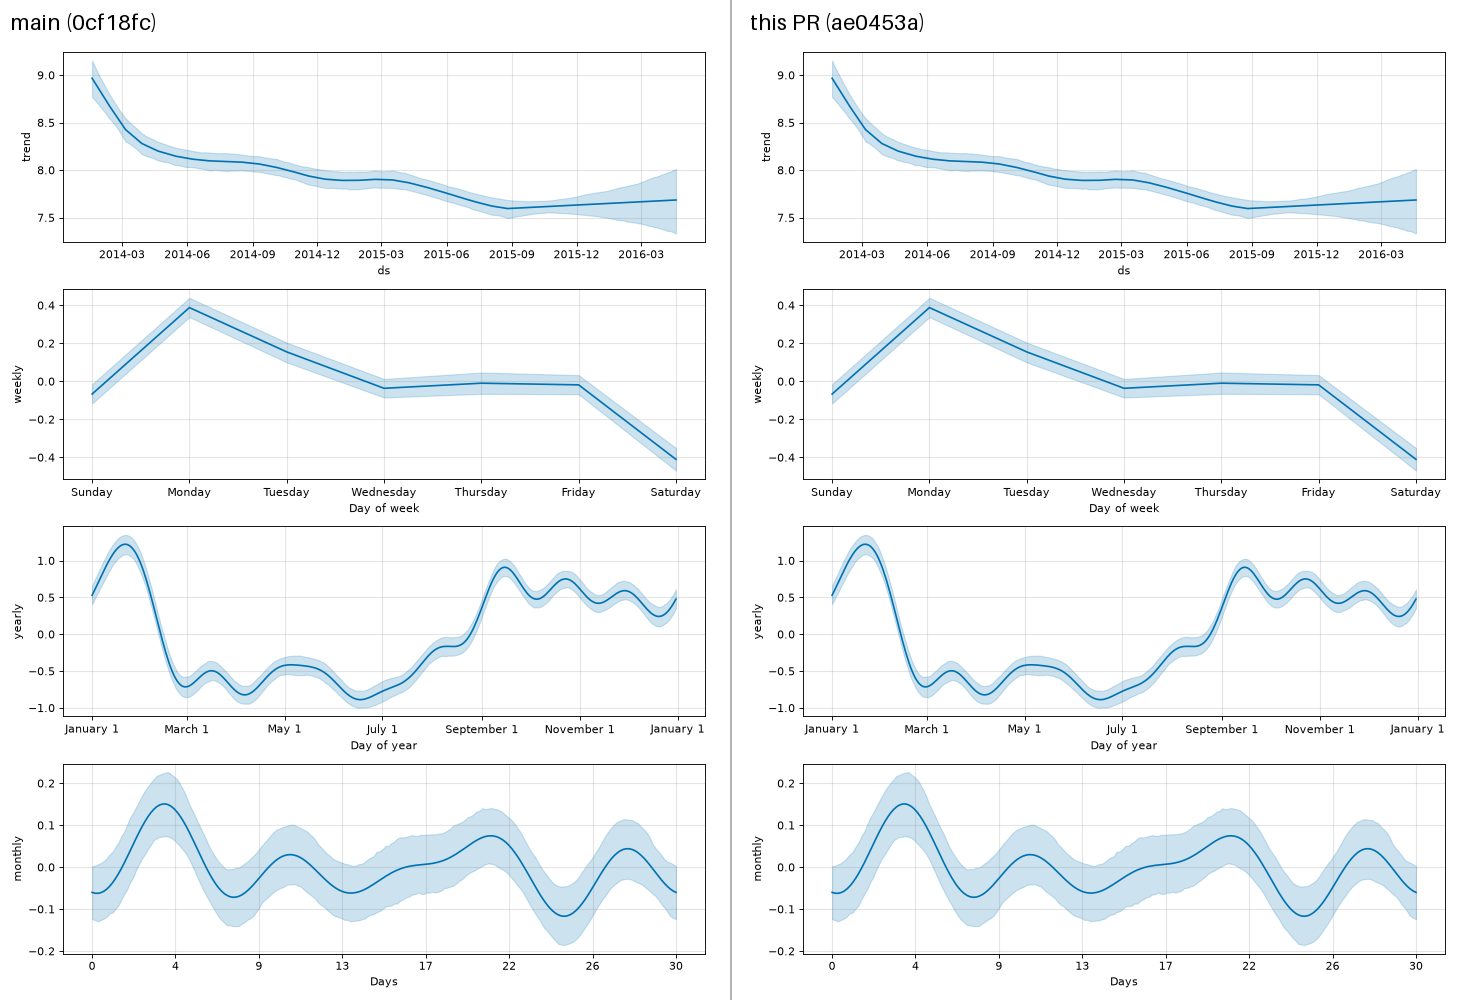
MCMC fit with a custom monthly seasonality, so the seasonality intervals are drawn:
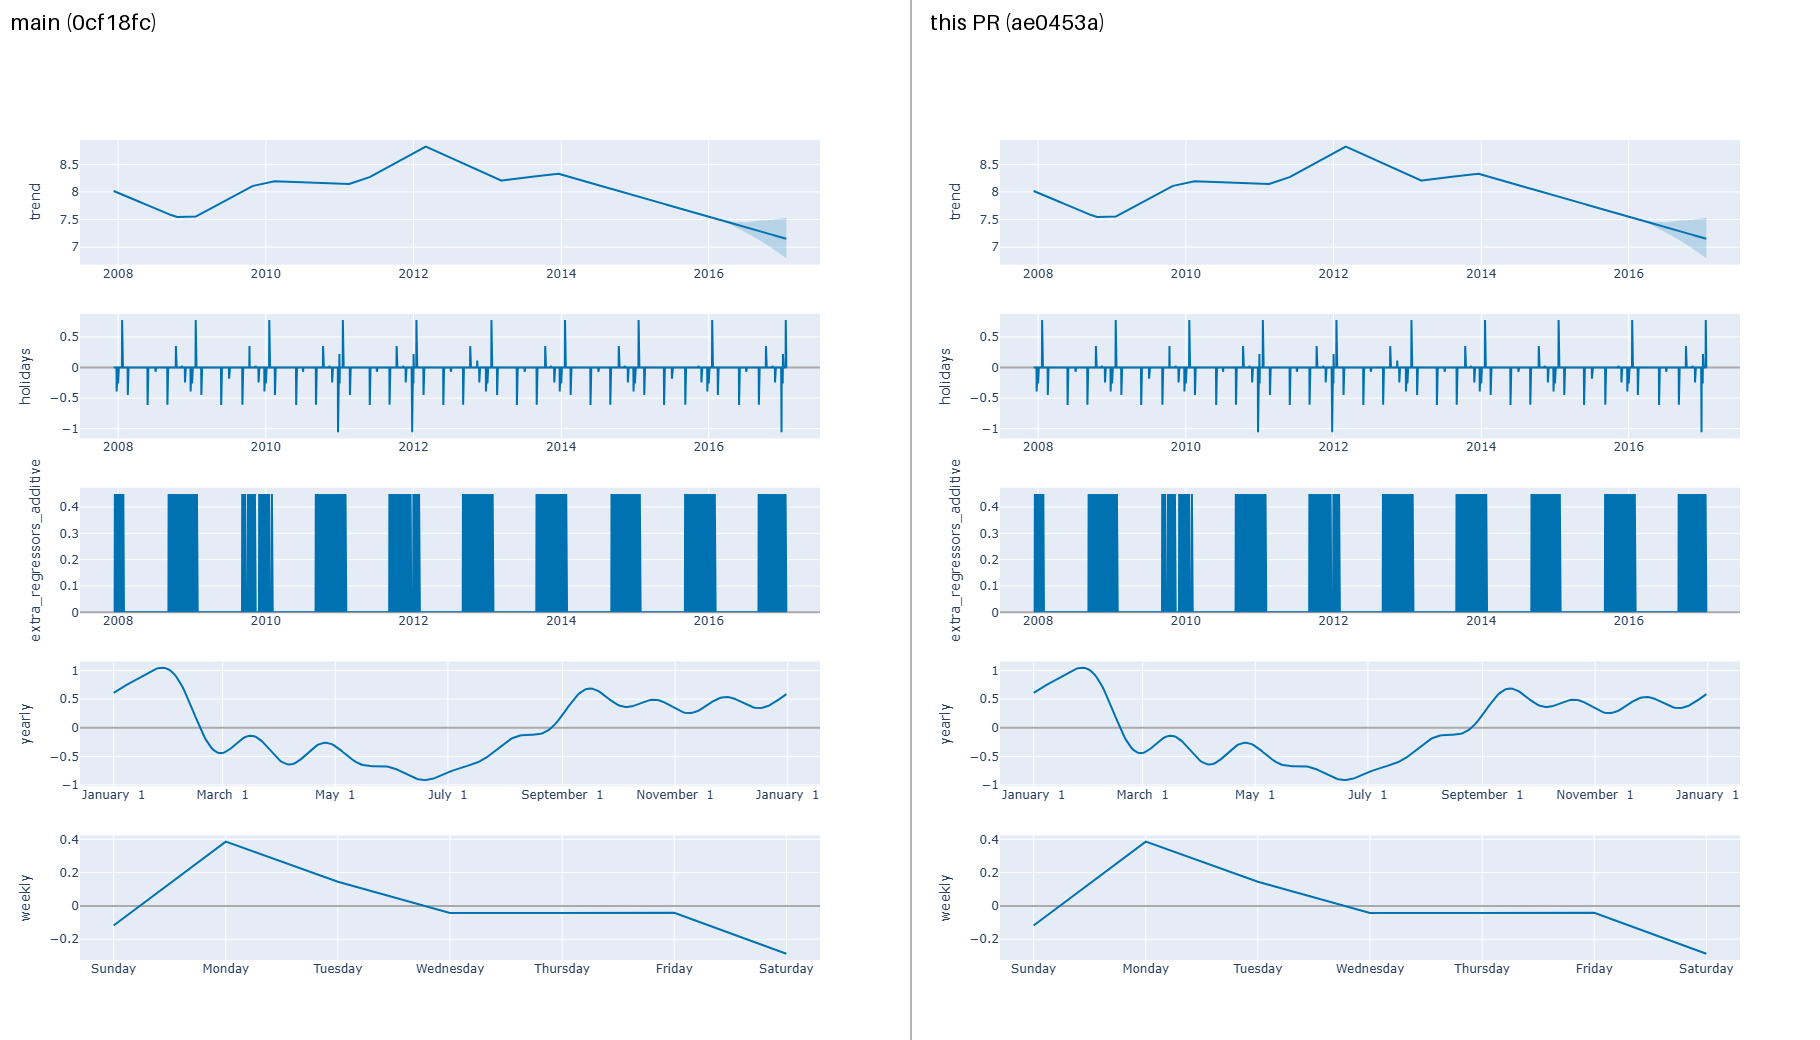
The first model with
|

tcuongd
approved these changes
Oct 21, 2026

This file contains hidden or bidirectional Unicode text that may be interpreted or compiled differently than what appears below. To review, open the file in an editor that reveals hidden Unicode characters.
Learn more about bidirectional Unicode characters
Sign up for free
to join this conversation on GitHub.
Already have an account?
Sign in to comment
2 participants


Add this suggestion to a batch that can be applied as a single commit.This suggestion is invalid because no changes were made to the code.Suggestions cannot be applied while the pull request is closed.Suggestions cannot be applied while viewing a subset of changes.Only one suggestion per line can be applied in a batch.Add this suggestion to a batch that can be applied as a single commit.Applying suggestions on deleted lines is not supported.You must change the existing code in this line in order to create a valid suggestion.Outdated suggestions cannot be applied.This suggestion has been applied or marked resolved.Suggestions cannot be applied from pending reviews.Suggestions cannot be applied on multi-line comments.Suggestions cannot be applied while the pull request is queued to merge.Suggestion cannot be applied right now. Please check back later.
Closes #1988
As suggested in #1988, this moves the code that computes the data for the component plots out of the plotting functions and into two private helpers in
prophet/plot.py, parametrized by the component name. Both the matplotlib and the plotly functions now take their data from them, so the data can be reused (for example by other plotting backends, or to get the numbers behind a plot as in #1920)._forecast_component_plot_data(m, fcst, name, uncertainty=True, plot_cap=False)returns the data fortrend,holidaysand theextra_regressors_*components as a dataframe:dsandname, plusname_lowerandname_upperwhen the uncertainty interval is shown, pluscapandfloorwhenplot_capis set and they are available. Used byplot_forecast_componentandget_forecast_component_plotly_props._seasonality_plot_data(m, name, ds, uncertainty=True)evaluates a seasonality on the given dates (seasonality_plot_dffollowed bypredict_seasonal_components) and returnsdsandname, plusname_lowerandname_upperwhen the interval is shown. Used byplot_weekly,plot_yearly,plot_seasonalityandget_seasonality_plotly_props.The rules for what goes into the data are the same as before: the interval needs
uncertainty and m.uncertainty_samples, the cap needs'cap' in fcst and plot_cap, and the floor needsm.logistic_floor and 'floor' in fcst and plot_cap. The plotting functions now draw whichever columns the helper returns, and plotly still leaves out an interval whose bounds are all equal.Each plotting function still picks its own dates for a seasonality. The two backends use different grids today (7 days, 365 days or 200 points for matplotlib; one point per day, hour or minute of the history's precision for plotly), and those grids are left as they are so that no plot changes. There are no public API changes and no new dependencies.
Left for possible follow-ups: the holiday hover text of the plotly holidays plot, and the choice and order of the panels in
plot_componentsandplot_components_plotly(the two backends differ there, so merging that logic would change one of them).Tests
New
prophet/tests/test_plot.py(20 tests; there were no plot tests before). It fits models with holidays, an extra regressor, a custom seasonality and a conditional seasonality, as additive/linear and as multiplicative/logistic with cap and floor, plus one withuncertainty_samples=0, and checks that:_forecast_component_plot_datareturns the forecast columns, with and without the interval, with and without cap and floor, and without error when the forecast has no_lower/_uppercolumns at all;_seasonality_plot_datamatchespredict_seasonal_components(seasonality_plot_df(m, ds))exactly (including the conditional seasonality, which is evaluated with its condition on);plot_forecast_component,plot_weekly,plot_yearly,plot_seasonalityand the two plotly props functions draw exactly the helper data, and draw an interval only when the helper returns one.The same 20 tests also pass against the unchanged
plot.pyfrommainwith only the two helpers appended, so the plots onmainalready draw exactly this data.Before/after comparison: a script rendered every component plot from
mainand from this branch using the same saved models and forecasts. The models were: additive with MCMC (so the seasonal intervals are not empty) with US holidays, a regressor, a custom and a conditional seasonality; multiplicative logistic with cap and floor, custom holidays, regressors in both modes and a second yearly-period seasonality;uncertainty_samples=0; and 5 minute sub-daily data. It coveredplot_components(all combinations ofuncertainty,plot_cap,weekly_startandyearly_start),plot_forecast_component,plot_weekly,plot_yearly,plot_seasonality,plot_components_plotly,plot_forecast_component_plotlyandplot_seasonality_plotly. For the 146 matplotlib figures it recorded the line data, thefill_betweenvertices, ticks, tick labels, axis labels, limits and a SHA-256 of the PNG rendered with Agg; for the 86 plotly figures,fig.to_json(). All 232 outputs are byte-identical betweenmainand this branch. As a check of the comparison itself, scaling the helper output by1 + 1e-15and dropping the floor made 160 of the 232 outputs differ.Tested with:
prophet==1.5.0wheel with the repository sources first onPYTHONPATH.test_plot.pyand the before/after comparison.Results:
python -m pytest prophet/tests/(Python 3.12): main 118 passed, 2 skipped; this branch 138 passed, 2 skipped (the same 118 plus the 20 new tests).python -m pytest prophet/tests/test_plot.py: 20 passed on both Python 3.12 and Python 3.10.pyrefly check: 0 errors (18 suppressed) on both main and this branch.