


English | 简体中文
High-performance, Rust-backed columnar kernel for stock / candlestick (OHLCV) time-series data.
volas is a Rust-backed, pandas-shaped DataFrame for live OHLCV pipelines: 254 trading-indicators, incremental O(lookback) refresh, and NumPy/Torch-ready output.
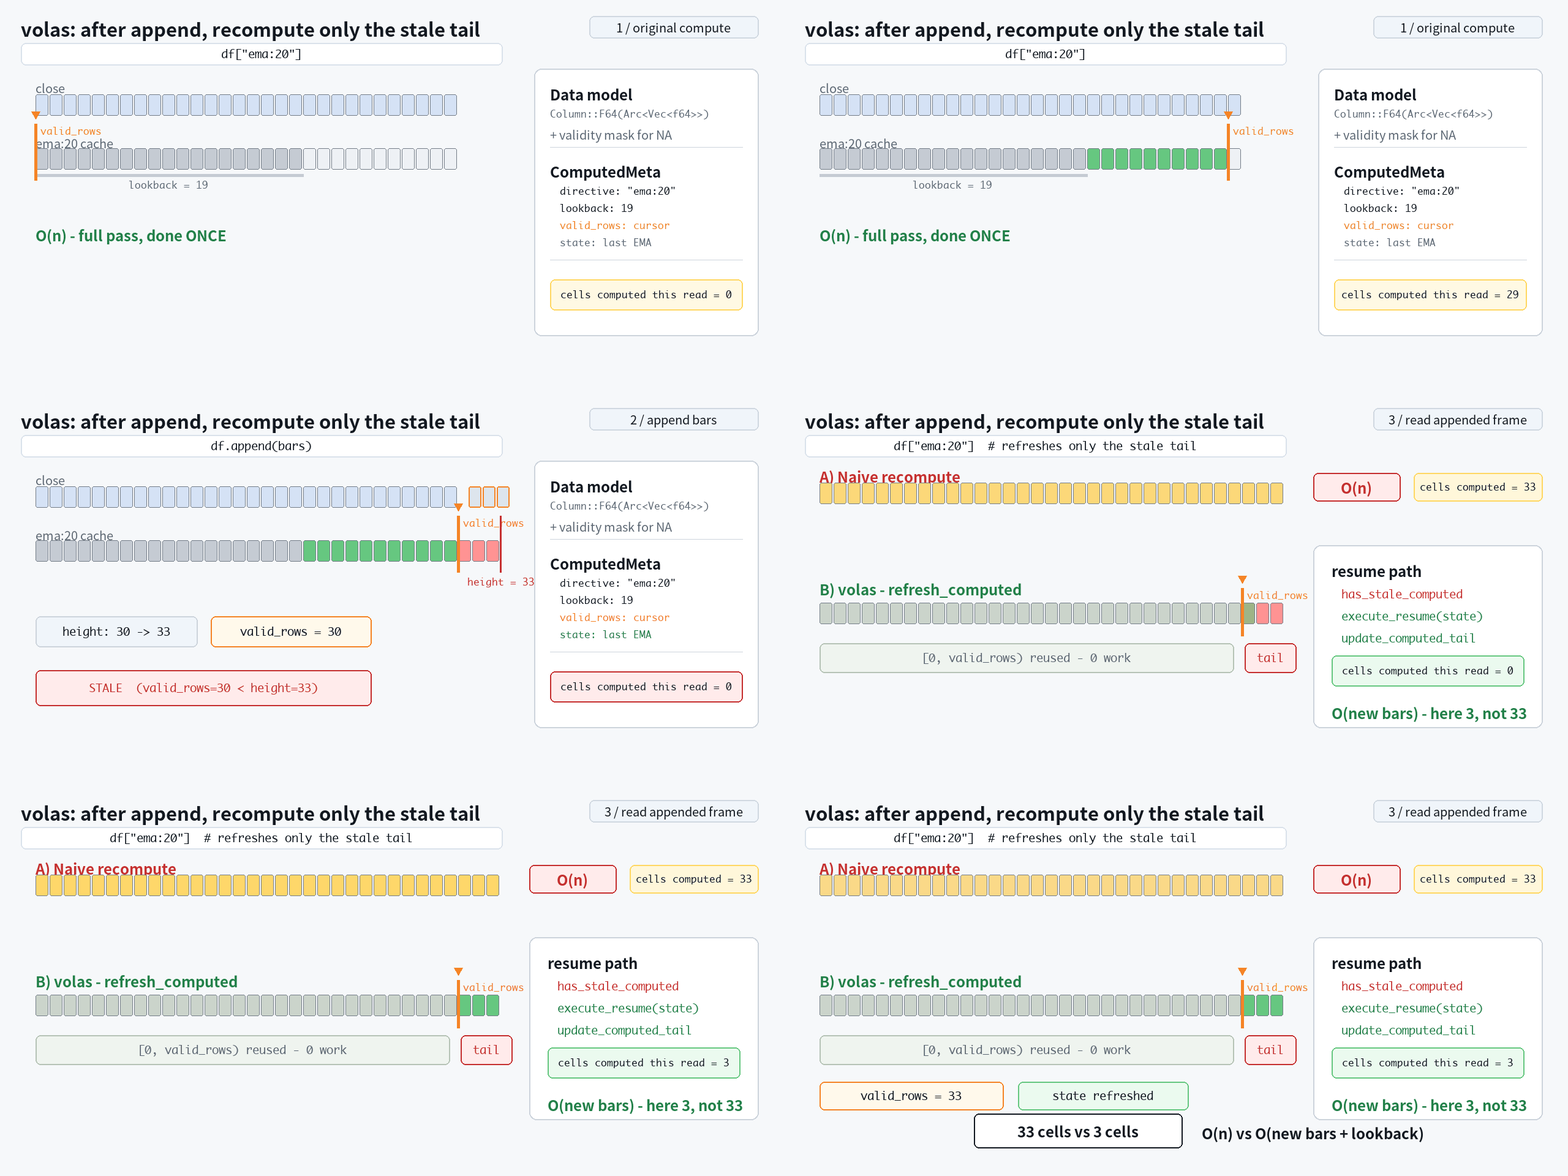
It is not a general-purpose pandas replacement. It is a narrow, fast DataFrame for candlestick / OHLCV workflows: append a new bar, keep indicator columns cached, and refresh only the stale tail.
volas is also a Rust crate.
from volas import read_csv

df = read_csv("aapl_1m.csv")

# Cache indicator directives as DataFrame columns.
df["rsi:14"]
df[["macd", "macd.signal", "atr:14"]]

# In a live loop:
df.append(new_bar)     # one-row OHLCV frame
df["rsi:14"]           # refreshes only the affected tail, O(lookback)
features = df.to_numpy()- 254 built-in indicators and TA-Lib-compatible directives
- Incremental refresh after
append: O(lookback), not O(n) - Rust kernels, no pandas runtime dependency
- pandas-shaped indexing:
.loc/.iloc/.at/read_csv/to_numpy - NumPy / Torch-ready output
pip install volasOn our reproducible benchmark suite, volas is faster than pandas, polars, stock-pandas and TA-Lib on most live-update indicator workloads.
- pandas-shaped API. The same
.loc/.iloc/.at,read_csv,to_numpyand resampling — for OHLCV workflows, change the import and keep your code. It is not a general-purpose pandas replacement. (See what's not covered) - Fast on live OHLCV indicator workloads, with reproducible benchmarks —
see the always-current live benchmark report.
- On the current published report, volas beats TA-Lib on 139 / 157
covered indicators by the default ratio — reproducible via
make benchmark. - On incremental update (each new bar), volas is the fastest of every library across all indicators — ~5× faster than TA-Lib, and up to ~360× faster than pandas.
- On the current published report, volas beats TA-Lib on 139 / 157
covered indicators by the default ratio — reproducible via
- Built for the live tick. A new bar touches only the affected tail
(
O(lookback), notO(n)); indicators refresh in microseconds, never a full recompute. - Rust inside, NumPy / Torch out. Compiled kernels — hot paths tuned down to the
assembly-instruction level — zero pandas at runtime;
to_numpy()feeds NumPy andtorch.Tensorpipelines.
I've spent years building quantitative trading-signal systems, and for most of
that time pandas was just the tax I paid to get any work done. Loading a single
CSV of a few hundred thousand candlesticks, computing a handful of indicators,
cleaning them up, normalizing — that one data-processing pass routinely took 10
to 20 minutes before any real research could even begin.
Backtesting made it worse. To honestly simulate live trading you feed history in
one bar at a time — usually fine-grained bars, say 1-minute candles — appending
each new bar to the DataFrame and recomputing every indicator across the whole
frame again, bar after bar, to mimic the OHLCV stream a live system actually sees.
So much of that was pure waste — the same columns rebuilt from scratch on every
step — and across a few years of 1-minute data that redundant work alone could
drag a single backtest out by hours. Every idea I wanted to try, every parameter
I wanted to sweep, paid that tax again. The tooling, not the thinking, was setting
the pace of my research.
So I stopped patching around it and rebuilt the whole data layer from the ground
up, pandas thrown out entirely. The bet paid off: the data-processing pass that
used to take 10–20 minutes now finishes in seconds, and the per-bar recomputation
that used to drag those runs out collapsed to near nothing. A backtest still has
real work to do — strategy logic, fills, accounting — but the data layer stopped
being the thing I sit and wait on. volas is that layer: hundreds of times
faster where it counts, and finally fast enough to get out of the way.
volas is not a general-purpose pandas replacement — for plain dataframe analysis, keep pandas or polars. It is a narrow, fast DataFrame for the case where a new OHLCV bar arrives and indicators must refresh now:
| pandas | polars | TA-Lib | volas | |
|---|---|---|---|---|
pandas-shaped indexing (.loc / .iloc / .at) |
✅ | ❌ | ❌ | ✅ |
OHLCV-native indicator directives (df['rsi:14']) |
❌ | ❌ | ✅ | ✅ |
| Indicator cache owned by the frame | ❌ | ❌ | ❌ | ✅ |
Incremental O(lookback) refresh on a new bar |
❌ | ❌ | ❌ | ✅ |
| Rust-backed kernels, no pandas at runtime | ❌ | ✅ | C | ✅ |
| NumPy / Torch export | ✅ | ✅ | arrays | ✅ |
The reference sections live in focused guides under docs/; each
entry below links into its guide.
- Installation
- Quick start
- Usage
- Bounded rolling window
- Cumulation and DatetimeIndex
- TimeFrame
- Syntax of directive
- Indexing & selection
- Writing & assignment
- Timezones
- Reproducible timezone deployment
- Missing values (
volas.NA) - pandas interop
- Arrow & DLPack interop (zero-copy)
- Error handling
- Built-in Indicators
- License
- For Developers
pip install volasRequires Python >= 3.11. Wheels are published for Linux (x86_64 / aarch64), macOS (x86_64 / arm64) and Windows (x86_64). For a local build from source, see For Developers.
Verify the install in 30 seconds, then see the examples/ — each
is self-contained and prints an OK: line:


pip install volas
python examples/00_install_check.py
python examples/03_live_ohlcv_append.py   # append a bar, refresh only the stale tail
More docs: TA-Lib migration, pandas migration, directive cheat sheet, and when not to use volas.
from volas import DataFrame

df = DataFrame({
    'open':   [2.0, 3.0, 4.0, 5.0, 6.0, 7.0],
    'high':   [12.0, 13.0, 14.0, 15.0, 16.0, 17.0],
    'low':    [1.0, 2.0, 3.0, 4.0, 5.0, 6.0],
    'close':  [3.0, 4.0, 5.0, 6.0, 7.0, 8.0],
    'volume': [100, 200, 300, 400, 500, 600],
})

# A plain column -> Series
df['close']
# 0    3.0
# 1    4.0
# 2    5.0
# 3    6.0
# 4    7.0
# 5    8.0
# Name: close, dtype: float64

# An indicator directive -> Series (2-period SMA of `close`)
df['ma:2']
# 0   <NA>
# 1    3.5
# 2    4.5
# 3    5.5
# 4    6.5
# 5    7.5
# Name: ma:2, dtype: float64

# A boolean directive -> bool Series, usable as a row mask
bullish = df['close > open']
df[bullish]                      # DataFrame of the rows where close > open

# Several directives at once -> DataFrame
df[['ma:2', 'ma:3', 'close > open']]

# Export to NumPy (and, zero-copy, to Arrow / DLPack — see the interop section)
df['close'].to_numpy()           # 1-D ndarray
df.to_numpy()                    # 2-D ndarray (rows x columns)
Cumulation accepts empty datetime frames and applies the
requested aggregation rules even at the same time frame. Window declarations
also accept raw columns (max_lookback=['close'], lookback zero). A physical data
column owns every equivalent directive spelling; schemas reject two labels for
one identity (for example, ema:2 and EMA:02). Column projections preserve
labels and values and start a new computation series. See
derived frames. NumPy bool masks on either
indexing axis respect positive and negative strides.
Arrow imports borrow matching buffers by default (copy=False). Arrow data is
immutable: the producer and every alias must never write borrowed memory while
imported objects or views survive. copy=True takes an owned snapshot; conversion
layouts still copy. Direct NumPy imports copy. See the
interop contract.
The complete directive reference lives in INDICATORS.md. It covers Volas-exclusive indicators, built-in statistical commands, and TA-Lib-compatible directives.
Rust callers obtain a validated, opaque volas_directive::Ast through parse or
bind_frame. Inspect it through node() and continuation(); command arguments
expose read-only values(), spec(), and bare() accessors. Execution, lookback,
and continuation APIs accept &Ast. The binder prepares the continuation plan
once, including any stateful subtrees and their hidden input columns. stringify
accepts &Ast or a lenient &Form using the same canonical renderer.
Rust compute::window helpers return typed WindowError results for invalid
window, decay, quantile, rank, or input-shape parameters; see the
compute crate guide. time::Agg::reduce rejects
empty or out-of-range selections. time::aggregate_period requires non-empty,
ordered datetime bars within one period and rejects NaT or multiple periods.
Issues, indicator requests, benchmark challenges, and PRs are welcome — see CONTRIBUTING.md and open an issue. The most useful feedback is on the API surface and the benchmark methodology.
If you build live OHLCV / technical-indicator pipelines in Python, star the repo to follow new indicators, benchmark results, and releases.
Developer notes, local build commands, dependency groups, and benchmark report guidance live in DEVELOPMENT.md.